KEEP IN TOUCH
Subscribe to our mailing list to get free tips on Data Protection and Cybersecurity updates weekly!


Google Chrome is getting a new browser heads-up display (HUD) that displays performance metrics about the web pages you are visiting.
In April, Google introduced a new initiative called Core Web Vitals that measures a webpage’s performance and user experience metrics that are needed to offer a good user experience when browsing a website.
The Core Web Vital metrics that Google is currently measuring is Largest Contentful Paint (LCP), First Input Delay (FID), and Cumulative Layout Shift (CLS), which are described below.
In May 2021, Google will utilize a web site’s Core Web Vitals metrics as a ranking factor in the Google search engine algorithms.
To help users analyze these metrics on web pages, Google released a Chrome extension named Web Vitals that displays an on-screen HUD with performance metrics for web pages you are visiting.
Also Read: Key PDPA Amendments 2019/2020 You Should Know
In the Google Chrome Canary builds, Google is doing away with the need of an extension and is creating a built-in HUD that displays real-time performance metrics while using a web page.
As you can see below, this HUD will site in the upper right of a web page and will show performance metrics for Largest Contentful Paint (LCP), First Input Delay (FID), and Cumulative Layout Shift (CLS),

As part of this feature, the Chrome developers also added a new measurement called Average Dropped Frame (ADF).
The ADF metric is a smoothness metric that measures the GPU and rendering performance of a webpage. The lower the ADF, the smoother the page will be, while higher dropped frames will cause “jank,” or stuttering and choppiness, when using the webpage.
There is still quite a bit of work to be done with this feature as the text is too small to be easily read, it can overlay important parts of a web page, and there is no easy way to disable the HUD. Google is actively working on fixing [1, 2] these issues.
However, when ready, this feature will be very useful for developers who are trying to squeeze as much performance out of their sites as they can or SEOs who want to rank better in Google search results.
To try out the new performance metrics HUD, you need to first install Google Chrome Canary.
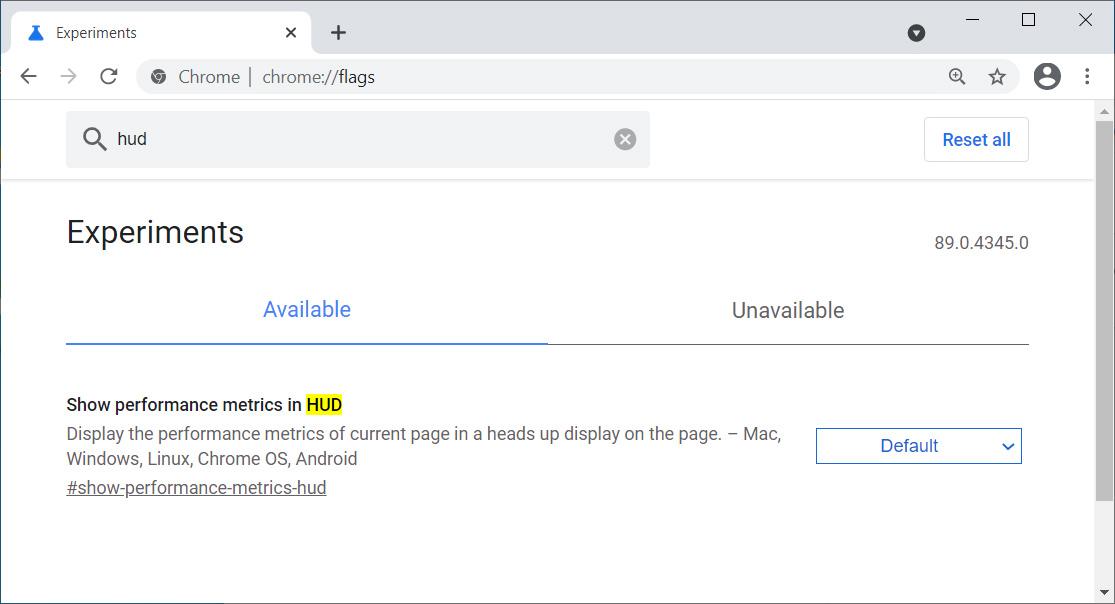
Once Chrome Canary is installed, you can enable the HUD feature by following these steps.
 Enable Show performance metrics in HUD flag
Also Read: 15 Best Tools For Your Windows 10 Privacy Settings Setup
Once Google Chrome restarts, you will see the performance metrics HUD while you browse the web.